

From Carbon Anxiety to Compliance-Driven Cost Reduction: 3 Common Digital-Transformation Barriers in Enterprise Energy Management — and How to Address Them

From Carbon Anxiety to Compliance-Driven Cost Reduction: 3 Common Digital-Transformation Barriers in Enterprise Energy Management — and How to Address Them
Reducing energy consumption and electricity-related emissions across individual sites is one of the first challenges companies must address when turning carbon-reduction commitments into action. For most manufacturers, energy use is a major source of Scope 1 and Scope 2 emissions. Once a company has set a decarbonization target, it must therefore translate that enterprise-wide commitment into energy-improvement actions that each site can execute, track, and verify.
International examples likewise show that manufacturing decarbonization must be implemented at the site level before results can be measured in concrete terms. In 2025, the World Economic Forum (WEF) recognized Siemens' Fürth plant in Germany as a Sustainability Lighthouse. According to WEF data, the site reduced its absolute energy consumption by 12% even as total output increased by 145%; on an energy-per-unit-of-output basis, consumption fell by 64%. The significance of this case lies not in the savings from any single piece of equipment, but in the ability to continuously measure site energy use, establish management baselines, and embed improvement measures into daily operations — thereby converting decarbonization targets into trackable energy performance.
Enterprise-level decarbonization targets, however, do not directly tell facility teams how much energy they should reduce each year, which equipment should be prioritized, or how to prove that improvement measures have delivered measurable benefits. Long-term carbon commitments therefore need to be broken down step by step: first into reduction milestones for different years; then into measurable and comparable energy-performance indicators tailored to the operating characteristics of factories, buildings, or data centers; and finally into annual site-level energy-saving targets and improvement actions. The process of translating corporate commitments into site-level execution can broadly be divided into four levels:
Level 1:Corporate commitment: Make a public commitment and obtain external validation.
Level 2: Phased milestones: Use years such as 2014, 2020, 2025, and 2030 as interim milestones and define reduction targets for each phase.
Level 3: Site-specific indicators: Convert targets into measurable metrics by facility type — EI (Energy Intensity) for factories, EUI (Energy Use Intensity per unit of floor area) for buildings, and PUE (Power Usage Effectiveness) for data centers — with separate five-year targets for each.
Level 4: Site execution: Translate the indicators into annual energy-saving targets for each site and manage them through the PDCA cycle: planning, implementation, monitoring, improvement, and scaled deployment.
Delta provides one example. Its 2°C target, proposed in 2017, was validated by the Science Based Targets initiative (SBTi), followed by validation of a 1.5°C target in 2022. By 2024, Scope 1 and Scope 2 emissions had fallen 53.6% from the 2021 baseline, while renewable electricity use had reached 84%. These results did not come from corporate commitments alone. They were achieved by applying the four levels above to progressively translate decarbonization targets into measurable site-level indicators and into energy-improvement actions that facilities can execute and verify.
The first two levels primarily address the company's decarbonization direction and timetable, which headquarters can establish through governance mechanisms and external frameworks. The latter two levels move into the actual site environment, where consistent energy data, credible measurement baselines, and continuously operating management processes are required. This is often where "carbon anxiety" emerges: the company has already made an external decarbonization commitment, yet facility teams still struggle to answer where energy is being consumed, what should be improved first, and how much energy use and carbon emissions have actually been reduced after improvements are implemented.
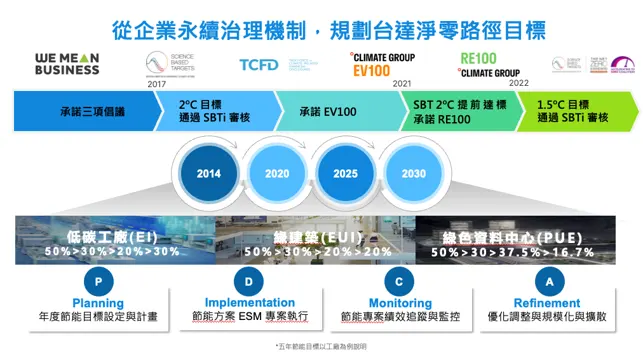
How corporate commitments are translated down to the site level: the key breakpoints lie in the latter two of the four levels.
Two Pressures Converge: Compliance and Cost
This gap has become increasingly difficult to ignore. On the compliance side, companies that have committed to SBTi targets must report progress annually, while CDP questionnaire results directly affect customer assessments. Even more immediate pressure comes from supply chains: brand owners are cascading their own Scope 3 targets upstream, leaving suppliers to meet specific reduction percentages and annual verification requirements. For regulated products exported to the European Union, the Carbon Border Adjustment Mechanism (CBAM) further links energy efficiency to product cost structures.
On the cost side, electricity prices are trending upward in many markets. Energy efficiency has therefore become both a decarbonization issue and a profit-and-loss issue. Budgets may be easier to secure, but projects must still demonstrate verifiable financial performance.
Taken together, these two pressures are driving more companies to deploy energy management systems each year. Yet putting a platform online does not mean that energy management has truly been embedded in operations. Many sites continue to accumulate data, but the way that data is presented remains disconnected from the day-to-day work of facility teams. Monthly energy-saving meetings still require improvement proposals, while on-site personnel must spend substantial time organizing and interpreting data themselves because the system does not proactively identify anomalies or uncover energy-saving opportunities.
The real issue is not a lack of data, but the failure to convert data into decision support for energy-saving and decarbonization targets. The following three barriers are not unique to any one product or industry. They are the three most common breakpoints as energy management systems evolve from monitoring tools into management platforms: first, data across equipment, systems, and sites fails to form a consistent and trustworthy energy-data foundation; second, even when data has been centralized, the lack of contextualized indicators, baselines, and analytical methods prevents it from being converted into actionable energy-saving opportunities; and third, once improvement measures have been completed, actual savings are difficult for management, finance, and audit functions to validate because baselines, influencing factors, and verification methods were not defined when the project was initiated.
These three issues correspond respectively to data acquisition, analytical decision-making, and results verification — the most common gaps in the closed-loop management of energy performance.
Barrier 1: Energy Data Is Fragmented Across Systems and Sites
In an interview study of organizations in Asia-Pacific and Europe, approximately 60% of respondents identified fragmented data and information silos across systems as the biggest barrier to implementing digital energy management — a higher proportion than for any other challenge.
At the site level, this is a very tangible problem. Meters within a single facility are often installed at different times and span multiple brands, models, and equipment generations, making direct data integration difficult. HVAC and lighting may be managed through a BMS (Building Management System), production-line data may reside in SCADA (Supervisory Control and Data Acquisition) or MES (Manufacturing Execution System), water and gas meters may still be read manually, and electricity bills may be stored as PDF files by the finance department. Data fragmentation is therefore caused not only by different communication protocols, but also by the fact that data belongs to different equipment, systems, and organizational functions.
Actual integration still requires teams to work through different communication protocols and the limitations of legacy systems. A BMS vendor may provide an interface, yet the data points made available may satisfy only half of the requirements. A firmware update on the same meter model may change register addresses. Some systems charge additional fees simply to export historical data. None of these issues is particularly difficult in isolation, but together they can add three to six months of integration work.
The largest impact often emerges only during subsequent expansion. A pilot site may be implemented successfully, prompting the company to roll the solution out to other locations; yet integration work at the second site can require two to three times as much effort as at the first, and deployment programs often stall around the fourth site. The underlying reason is that integration at the pilot stage was completed through customized work: point mapping was created device by device. That cost may be acceptable at one site, but as the number of sites grows, customization costs can rise exponentially.
Barrier 2: Data Is Integrated, but Facility Teams Still Cannot Identify Energy-Saving Opportunities
In the same study, 53% of respondents identified "difficulty converting existing energy data into actionable energy-saving measures" as a significant challenge, noting that the analytical work required to uncover savings opportunities consumes substantial staff time.
For facility teams, the problem is not the absence of data, but the disconnect between how the data is presented and the recurring work of proposing energy-saving measures and tracking decarbonization targets. A system may show how much electricity has been used, but without appropriate energy-performance indicators and interpretive benchmarks, a single consumption figure does little to reveal anomalies, trace potentially related equipment, or identify energy-saving opportunities that merit further evaluation.
For example, an 8% month-on-month increase in electricity consumption could reflect higher production, a change in ambient temperature, or declining efficiency in a specific piece of equipment. If the dashboard shows only absolute electricity consumption, facility teams still need to retrieve production volume, operating hours, equipment utilization, and other data themselves before they can determine whether the deviation comes from operational changes or deteriorating energy efficiency. If the platform cannot shorten this data aggregation and analysis process, even complete data sets will be difficult to translate into concrete, actionable improvement measures.
Alarm failure is another manifestation of the same problem. Alarm mechanisms are typically used to monitor whether equipment or systems are operating within efficient ranges, and poor operating efficiency often represents one of the best opportunities for energy and carbon reduction. In the first month after deployment, dozens of threshold-based alarm rules may generate hundreds of notifications, most of them triggered by normal load fluctuations at night, on holidays, or during production-line changeovers.
One-size-fits-all fixed thresholds cannot distinguish differences in equipment operating environments and conditions. The same chiller, for example, may require different energy-performance alarm ranges at different sites because chilled-water supply and return temperatures are set differently. If the system applies the same standard and the same alarm criteria to identical equipment and systems regardless of context, the alerts inevitably lose their usefulness. When on-site personnel are confronted with large volumes of invalid notifications, disabling the alarm function becomes the most common response — and the system consequently loses its ability to support anomaly detection.
Defining and selecting appropriate energy-performance indicators is an important step in effectively implementing Level 3 site-level energy-saving initiatives. EI, EUI, and PUE are not isolated figures; the denominators of these metrics vary as operating conditions change. Without appropriate data aggregation and indicator design, the system cannot determine why performance has improved or deteriorated, making it difficult to identify practical entry points for reducing energy consumption.
Barrier 3: Improvement Benefits Lack Consistent Quantification and Verification Standards
Energy-saving measures are usually proposed with a single estimated savings figure at the project-approval stage — for example, "replace the existing motor with a high-efficiency motor to save an estimated 120,000 kWh per year." Once the project is completed, however, actual electricity consumption may also be affected by lower production volumes, lower average temperatures, or fewer operating days.
The reduction shown on the electricity bill therefore cannot be attributed entirely to the equipment improvement. When management asks how much energy was actually saved, site teams often can only respond that electricity consumption did decline, but production also changed, making the two effects difficult to separate. Unless changes in operating conditions can be normalized and the contribution of the measure itself quantified, the savings will be difficult to validate — and securing the following year's budget will become more difficult.
The root cause is that project execution and performance verification are often managed as two separate processes. Energy-saving measures are managed by engineering teams, electricity-consumption data is stored in the energy management system, and the financial benefits calculated from utility bills are managed by finance. If these data sources cannot be brought together during benefit evaluation, each function ends up with its own version of the result.
The most effective approach is to define clear evaluation methods and quantification standards at the beginning of the project and establish an energy baseline from historical data before implementation. If the baseline is not created until project closeout, the required data may no longer be available, making it impossible to establish the baseline and therefore impossible to evaluate performance reliably.
What These Three Barriers Imply for Platform Requirements
The three barriers are interconnected. If fragmented data cannot be integrated, energy indicators cannot be established. If data exists but appropriate performance indicators do not, energy-saving opportunities are difficult to identify. Even if an opportunity is identified and implemented, savings cannot be properly evaluated without a baseline and predefined verification criteria. From the perspective of this article, an energy management platform capable of addressing these management barriers should meet at least the following conditions:
Requirement 1: Data Integration Capability
Energy data originates from on-site data-acquisition systems. Because these systems may have been introduced at different times or supplied by different vendors, integration through different communication protocols or APIs (Application Programming Interfaces) is common. Across different applications and operating scenarios, interoperability and protocol conversion for BACnet, Modbus RTU/TCP, OPC UA, MQTT, REST API, and similar standards — together with the use of edge gateways to isolate on-site communication network segments — should be fundamental capabilities of an integrated energy management platform.
Beyond connectivity, however, standardizing data from different brands, models, and source systems remains a major challenge. This determines whether data from similar equipment can be aggregated efficiently for calculation, analysis, and storage, and it directly shapes the cost structure of multi-site expansion.
Note|
BACnet stands for Building Automation and Control Network.
Modbus is an industrial communication protocol introduced by Modicon in 1979; RTU and TCP refer respectively to Remote Terminal Unit and Transmission Control Protocol as two transmission methods.
OPC UA stands for Open Platform Communications Unified Architecture.
MQTT was originally named Message Queuing Telemetry Transport; following standardization in 2013, MQTT became its official name.
REST API stands for Representational State Transfer Application Programming Interface.
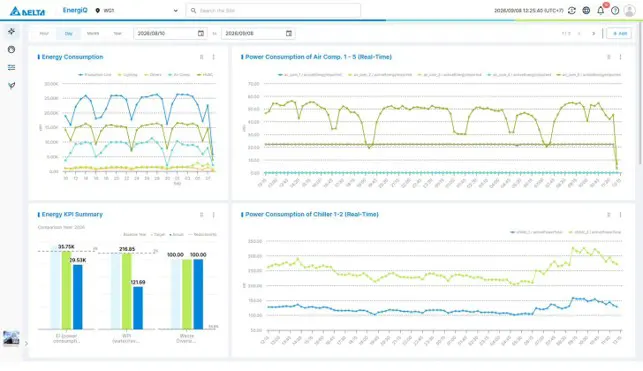
Once data is standardized, category-level and equipment-level energy consumption can be compared across sites using the same basis.
Requirement 2: Start with the Management Process, Not Just the Numbers on the Dashboard
Most energy management systems begin with data visualization and leave interpretation to people. Fewer platforms are designed to support the management process itself: guiding users through energy reviews based on audit logic, identifying Significant Energy Uses (SEUs — energy uses that account for a significant share of an organization's consumption or offer substantial improvement potential), setting energy-performance indicators, and establishing energy baselines.
An energy baseline should not rely solely on a single threshold or historical average. It should incorporate key influencing factors such as production volume, operating hours, and equipment utilization, and use regression analysis to establish a comparable benchmark. The former provides only a basic point of comparison; the latter can more fully reproduce the fluctuations in electricity consumption that existed before an energy-saving improvement was introduced, allowing facility teams to establish a more accurate benefit-evaluation mechanism and calculate actual implementation results.
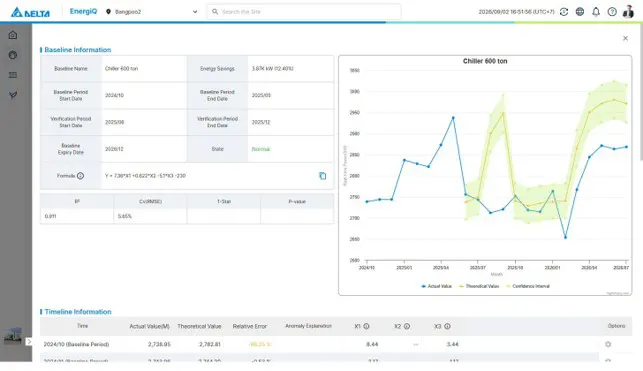
A regression-based baseline incorporating influencing factors replaces a single threshold or historical average.
Requirement 3: Integrate Verification Criteria into the Project
Energy-saving measures, investment amounts, estimated benefits, and actual results should all be integrated into the benefit evaluation of the same energy-saving project. The baseline period and verification method should be defined when the project is initiated, rather than added after completion. The value of this design is not primarily technical; it lies in process control. Projects that can demonstrate actual savings are in a materially different position when seeking approval for the following year's budget.
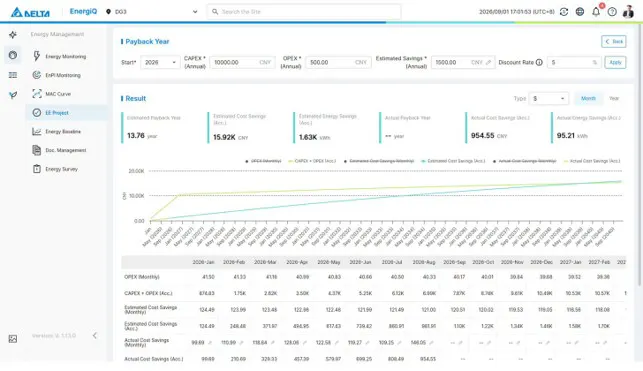
Presenting estimated and actual results side by side provides a basis for finance and audit functions to validate energy-saving outcomes.
How SustainX EnergiQ Addresses These Requirements
SustainX EnergiQ is Delta's intelligent energy management platform developed to support enterprise energy management and practical decarbonization. It helps companies convert fragmented energy data into actionable management inputs — from energy reviews and identification of high-energy-consumption hotspots to the assessment of energy-saving opportunities and ongoing verification of improvement results — so that enterprise-level decarbonization targets can be embedded in day-to-day energy management at individual sites.
The platform is designed around the ISO 50001 PDCA management process. It can integrate a company's existing third-party metering devices and systems, and supports both cloud-subscription and on-premises deployment models for energy-management applications. Beginning with enterprise site planning, the system structures management across three hierarchical levels — company, group, and site — enabling cross-site management and analysis of both physical and virtual site data to support decision-making.
Starting from corporate sustainability and energy-saving indicator settings, it helps organizations cascade targets down to the plant or site level and convert them into practical, trackable objectives. AI-based recommendations then use collected electricity-consumption data, energy KPIs, and root-cause analysis of inefficient equipment operation to help site personnel identify energy-saving opportunities automatically. Delta's decades of accumulated implementation experience and proven cases are also used to recommend potential solutions. Once several to dozens of Energy Saving Measures (ESMs) have been identified, the system can apply the Marginal Abatement Cost Curve (MACC) methodology to help site teams prioritize implementation, enabling plants to progress toward energy-saving and carbon-reduction targets in an optimized sequence.
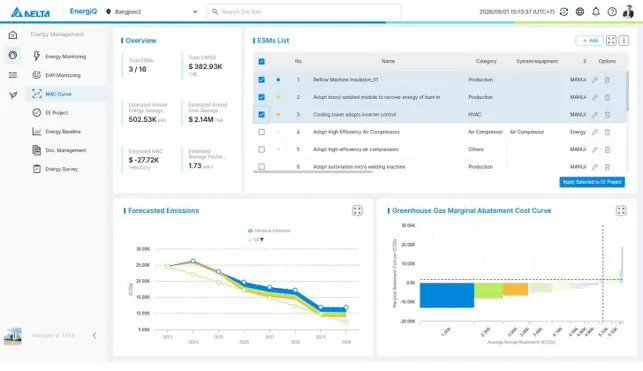
Identified energy-saving measures are prioritized according to the carbon-abatement cost per metric ton.
In addition, the execution of energy-saving projects and the establishment of corresponding energy baselines can support post-implementation benefit evaluation. Finally, large-language-model query capabilities can be used to generate reports from system data, presenting relevant forms and trends throughout implementation and providing supporting evidence for sustainability-related audits.
Five Questions to Ask During the Evaluation Stage
The following questions can be used to evaluate any supplier and are not designed for any specific product:
1. Has the scope of data points available from existing systems been fully assessed? How will the cost of adding missing measurements be estimated?
2. What is the estimated integration effort for bringing the second site online relative to the first site?
3. Which key influencing factors are included in the energy baseline? Can users adjust or rebuild the model based on production volume, operating hours, equipment utilization, and other conditions?
4. What criteria are used to identify anomalies? Do alerts provide directional or diagnostic information?
5. What methodology is used to verify improvement benefits? Can the outputs be used directly as supporting evidence for audits?
Which of These Three Barriers Have You Encountered?
Most organizations encounter more than one of these barriers. Sites where alarm functions have been disabled often also lack a quantitative basis for energy-saving projects. Likewise, expansion programs that are eventually discontinued often have their root cause embedded in the integration approach taken at the very first site.
If you are currently managing a stalled implementation project or are still in the evaluation stage, feel free to share in the comments which issue you encountered, at what stage it occurred, and how it was subsequently handled. You may also simply reply with the relevant number:
① Data is fragmented across systems and sites
② Data does not help identify energy-saving opportunities
③ Benefits lack a consistent verification basis
Operating conditions vary significantly across industries and regions, and comparing practical experience across sites is often more valuable than any specification checklist.
The next article will examine how consulting services, digital platforms, and decarbonization solutions can be connected when energy-management expertise cannot scale at the same pace as the number of sites.
About the Research Cited in This Article
Some of the data cited in this article comes from a 2025 customer interview study conducted by Verdantix. The study covered commercial offices, factories, data centers, and warehousing and logistics operators in Australia, Europe, East Asia (China and Japan), and Southeast Asia (Thailand and Singapore). Respondents were primarily management-level professionals in three functional areas: facilities management and building operations, real estate and technology, and sustainability and ESG. The research was commissioned by Delta Electronics.
Sources for the International Case Study
World Economic Forum,〈Global Lighthouse Network 2025: World Economic Forum Recognizes Companies Transforming Manufacturing through Innovation〉, January 14, 2025.
News source: Siemens
Siemens AG,〈World Economic Forum recognized Siemens' Fürth location as Sustainability Lighthouse〉, January 14, 2025.
Source: Siemens official press
【Delta's ESG Integrated Planning Office- Department Introduction】
Delta's ESG Integrated Planning Office was established to transform decades of practical experience into professional services spanning ESG and net-zero strategy, carbon management, energy management and energy-efficiency improvement, and supply-chain decarbonization.
This depth of practical experience is what differentiates us. Before advising customers, Delta first applied sustainability principles to its own operations. The company has earned a CDP Double A rating for five consecutive years, achieved the highest ESG score in the global electronic equipment industry in the Dow Jones Sustainability World Index for seven consecutive years, and became one of the first industrial companies to have an SBTi 1.5°C target validated. What Delta provide to customers is not theory, but experience that has been implemented in practice, continuously refined, and validated across different operating environments.
Delta's services cover three core areas: ESG strategy, net-zero and energy transition, and supply-chain engagement. These capabilities are integrated with digital platforms, energy management, and end-to-end decarbonization solutions. Delta help companies move from target-setting to concrete execution, identify energy-saving opportunities, improve energy performance, and accelerate sustainability transformation through clearer pathways, stronger governance, and measurable outcomes.
For more information, please visit Delta's website: Delta ESG Consulting Services Website
More related articles
